

Top 15 RevOps KPIs and how to measure them
As RevOps, getting lost in a sea of Metrics and KPIs is incredibly easy- especially when you’re throwing around acronyms left, right, and center.
CAC, NRR, CVR, CAC…
But each one is crucial it is to measure the success of your sales and Go-To-Market. They’re the bread and butter of RevOps, and you’re going to need them in your arsenal, and you monitor every aspect of your SaaS bowtie.
That means tracking the right KPIs is vital for growth and predictability.
In this article, we will go through 15 KPIs you should focus on, explain what each means, and give you examples of how to measure them.
1. Customer Acquisition Cost (CAC)
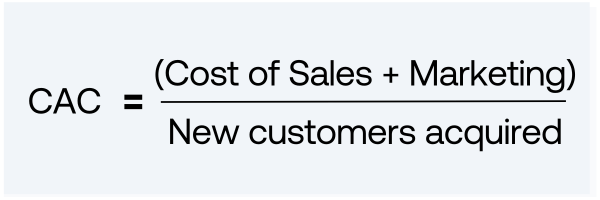
It shouldn’t be a surprise that understanding how much it costs to acquire each new customer would be on top of this list.
To calculate your CAC, divide your sales and marketing expenses for a given period by the number of new customers acquired during that time.
For example, if you spent $10,000 on sales and marketing and acquired 100 customers, your CAC would be $100.
Tracking this metric isn’t just about determining the financial investment required to acquire customers; it also provides direct feedback to your GTM strategy.
By analyzing your CAC, you can identify areas where you may be overspending or underperforming, allowing you to make data-driven decisions to optimize your customer acquisition process.
Understanding your CAC can help you set realistic goals and expectations for your business. By knowing how much it costs to acquire a customer, you can establish a benchmark for your marketing budget and allocate resources accordingly. This knowledge enables you to make informed decisions about scaling your business, launching new campaigns, or exploring different customer acquisition channels.
With that said, watching just your CAC does have its disadvantages.
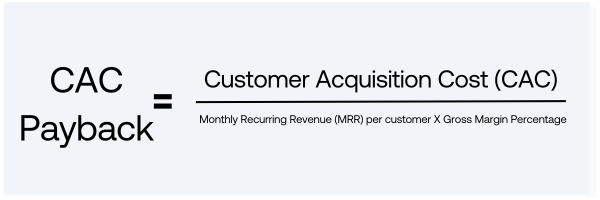
2. CAC Payback
While CAC is a great starting point, it does come with its share of drawbacks.
That’s why we recommend you look at your. CAC Payback, also known as your break-even point.
Essential, CAC:PB is the time it takes the company to recoup its spending. Intuitively, the shorter the Payback period – the better the business is doing.
Since revenues are realized over the duration of the subscription, it’s vital to know how long it takes for these revenues to cover the initial costs of acquiring customers. This helps in assessing the viability of the company’s marketing strategies and the overall health of its business model.
3. Customer Lifetime Value (CLTV)
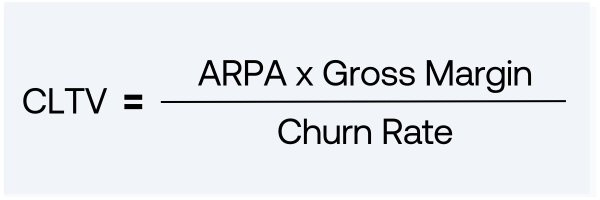
Customer Lifetime Value (CLTV) helps you understand the long-term value of your customers. It’s the predicted net profit that a customer is expected to generate throughout their entire relationship with your company.
To calculate CLTV, you need to consider three key factors: Average Revenue Per Account (ARPA), Gross Margin and Churn Rate.
- ARPA (Average Revenue Per Account): This is the average monthly revenue generated from each customer account. In a SaaS business, this would typically be the monthly or annual subscription fee multiplied by the number of months or years.
- Gross Margin: This is the percentage of revenue that remains after the cost of goods sold (COGS) is deducted. The gross margin is expressed as a percentage and represents the profitability of the company before operating expenses, interest, and taxes.
- Churn Rate: This is the rate at which customers cancel their subscriptions. It’s a critical factor in the SaaS business model, as high churn rates can significantly reduce CLTV. The churn rate is expressed as a percentage of customers who leave over a certain period.
Let’s take a look at an example. Let’s say your company has an ARPA of $500, a gross margin of 70%, and a monthly churn rate of 2%.
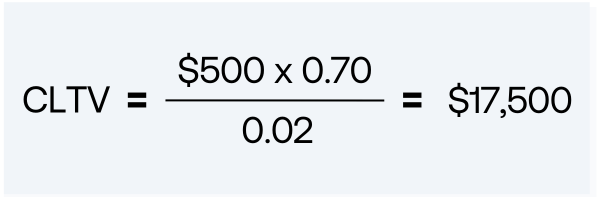
This means that, on average, each customer is expected to generate $17,500 in net profit throughout their entire relationship with your company. The bigger the number, the better.
One thing to keep in mind when it comes to CLTV, this is always a point-in-time calculation. This means it’ll change month to month, depending on the performance of your business.
4. Sales Cycle Length
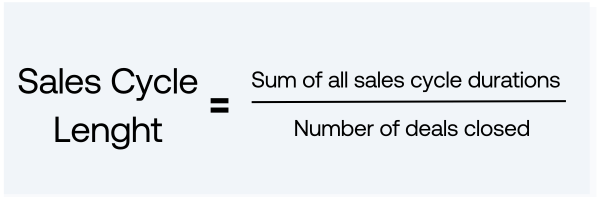
The sales cycle length measures the average time it takes from the initial contact with a prospect to closing the deal. By tracking this metric, you can identify bottlenecks in your sales process and optimize it for faster conversions.
Long story short: Aim to reduce your sales cycle length without compromising the quality of your deals.
There are plenty of reasons for a longer/short sales cycle. For example:
The complexity of your product/service: If your offering requires a longer decision-making process or involves multiple stakeholders, it is natural for the sales cycle to be longer. By streamlining your sales process and providing clear and concise information to your prospects, you can expedite the decision-making process and reduce the sales cycle length.
Quality of Leads: Not all leads are created equal, and investing time and effort in pursuing low-quality leads can unnecessarily prolong your sales cycle. By focusing on lead qualification and targeting prospects who are more likely to convert, you can shorten the sales cycle and improve your overall sales efficiency.
Sales Enablement: It’s essential to provide your sales team with the necessary tools and resources to navigate the sales cycle effectively. Equipping them with comprehensive product knowledge, effective sales scripts, and efficient CRM systems can streamline the entire process, enabling your team to close deals more efficiently and reduce the sales cycle length.
By understanding the factors that influence the sales cycle length and implementing strategies to optimize it, you can accelerate your sales conversions and drive business growth.
5. Sales Pipeline Velocity
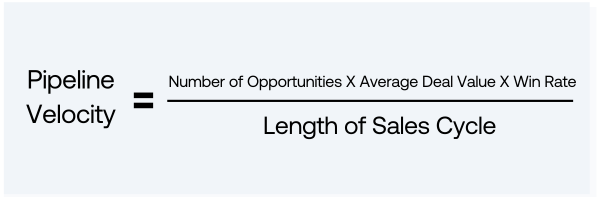
Sales pipeline velocity measures the speed at which prospects progress through your sales pipeline, moving from one stage to the next.
To calculate it, you simply divide the total value of closed-won deals by the time it took to close them.
For example, let’s say you have:
- 100 opportunities in the pipeline,
- An average deal value of $5,000.
- A win rate of 25% (meaning 25% of opportunities are successfully converted into sales),
- And an average sales cycle length of 60 days
That would look like this:
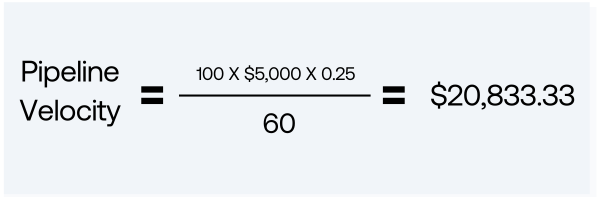
This result means the company’s sales pipeline generates approximately $20,833.33 in revenue per day, given the current opportunities, deal value, win rate, and sales cycle length.
A high velocity indicates that your sales process is streamlined, prospects are progressing smoothly, and deals are closing quickly.
On the other hand, a low velocity may indicate potential issues that need to be addressed, such as lengthy sales cycles or a lack of qualified leads.
6. Conversion Rate
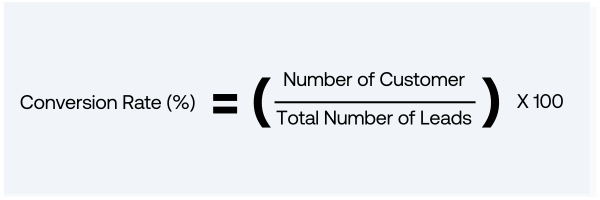
When we talk about conversion rate, we usually mean the metric that measures the percentage of leads that convert into paying customers.
To calculate it, divide the number of customers by the total number of leads and multiply by 100. For instance, if you have 500 leads and 100 of them become customers, your conversion rate would be (100 / 500) x 100 = 20%.
7. Annual Recurring Revenue (ARR)
ARR is the projected annual revenue generated from your recurring subscriptions. To calculate this KPI, multiply the average monthly recurring revenue (MRR) by 12. For example, if your MRR is $10,000, your ARR would be $10,000 x 12 = $120,000. Keep an eye on your ARR to gauge the stability and growth potential of your SaaS business.
8. Monthly Recurring Revenue (MRR)
MRR represents the sum of your recurring monthly subscription fees. It’s a critical metric for SaaS companies as it provides a clear picture of your monthly revenue. Track your MRR to identify trends, measure growth, and make informed decisions to drive your business forward.
9. Average Contract Value (ACV)
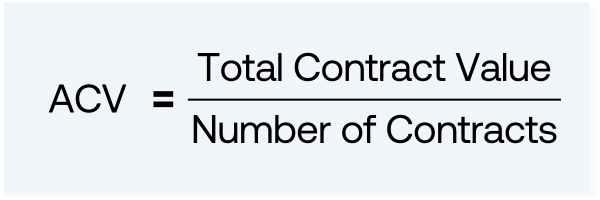
ACV refers to the average value of your contracts with customers. To find your ACV, divide your total contract value by the total number of contracts. For example, if you have 50 contracts worth a total of $100,000, your ACV would be $100,000 / 50 = $2,000.
10. Revenue Growth Rate
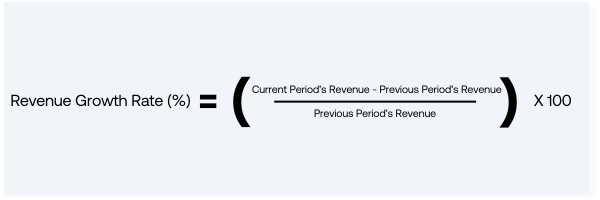
Revenue growth rate measures the percentage increase in your revenue over a specific period. To calculate this KPI, subtract your previous period’s revenue from your current period’s revenue, divide by your previous period’s revenue, and multiply by 100.
For instance, if you had $100,000 in revenue last month and $150,000 this month, your growth rate would be (($150,000 – $100,000) / $100,000) x 100 = 50%.
11. Net Promoter Score (NPS)
NPS measures customer loyalty and satisfaction. It’s calculated by asking customers to rate, on a scale of 0-10, how likely they are to recommend your product or service to others.
Divide your respondents into three categories: promoters (9-10), passives (7-8), and detractors (0-6). Subtract the percentage of detractors from the percentage of promoters to determine your NPS.
Aim for a high score, as it shows your customers are happy and willing to promote your brand.
For context, the average NPS score for B2B SaaS is somewhere between 31-50.
Keep in mind that as a metric, NPS scores aren’t always perfect and do come with some drawbacks. So make sure not to over-rely on it when you can.
12. Customer satisfaction score (CSAT)
In Case NPS isn’t enough, CSAT is another vital metric to assess customer satisfaction and loyalty. It asks customers to rate their satisfaction with a specific product, feature, or interaction on a scale.
Track your CSAT regularly and take necessary actions to improve customer experience and happiness.
13. Net Revenue Retention (NRR)
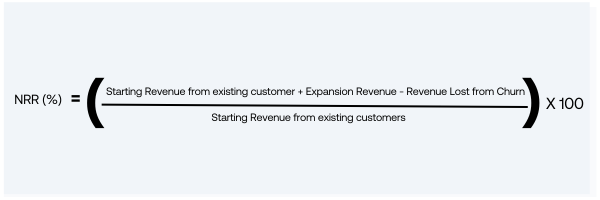
NRR measures your ability to retain and expand revenue from existing customers. To calculate NRR, sum up the revenue from existing customers at the beginning of a period, add expansion revenue, and subtract any revenue lost due to churn. Divide the resulting figure by the original revenue from existing customers, and multiply by 100. A positive NRR above 100% indicates successful revenue retention and expansion.
14. Renewal Rate
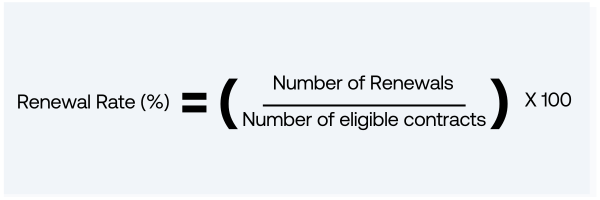
Your renewal rate indicates the percentage of customers who renew their subscriptions at the end of their contract term. High renewal rates demonstrate customer satisfaction and loyalty. To calculate your renewal rate, divide the number of renewals by the number of eligible contracts and multiply by 100. Strive to maintain a healthy renewal rate to ensure a sustainable revenue stream.
Keeping track of these RevOps KPIs is crucial for optimizing your sales and marketing strategies, scaling your business, and keeping your customers happy. Remember, these metrics can vary from company to company, so adapt them to your specific needs and goals.
15. Net Dollar Retention (NDR)
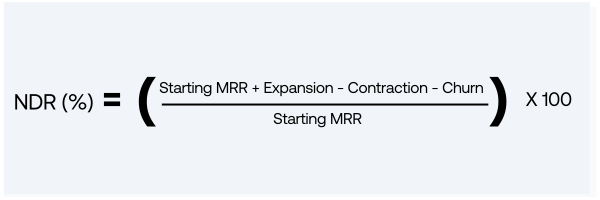
Net Dollar Retention (NDR) in B2B SaaS is a key metric that measures the revenue retained from existing customers over a specific period, factoring in upgrades, downgrades, and churn. It’s a crucial indicator of customer satisfaction and the company’s ability to grow revenue from its current customer base.
Where:
- Starting MRR is the Monthly Recurring Revenue at the start of the period.
- Expansion is the additional revenue from upsells or cross-sells to existing customers.
- Contraction is the lost revenue from downgrades by existing customers.
- Churn is the revenue lost from customers who cancel their subscription.
The result is expressed as a percentage. An NDR greater than 100% indicates that revenue growth from existing customers exceeds the losses from churn and downgrades, which is a positive sign of business health in B2B SaaS.
Here’s an example of what that looks like.
Say you’re looking at:
Starting Monthly Recurring Revenue (MRR) at the start of the period: $10,000
Additional revenue from upsells or cross-sells to existing customers (Expansion): $2,000
Lost revenue from downgrades by existing customers (Contraction): $500
Revenue lost from customers who cancel their subscription (Churn): $1,000
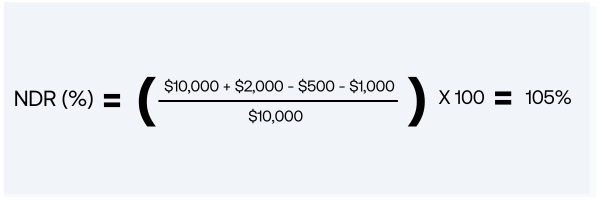
The Net Dollar Retention (NDR) would be 105%. This means that, after accounting for upsells, downgrades, and churn, the company has retained 105% of its starting revenue from existing customers, indicating revenue growth from the existing customer base.
Track every KPI with Growblocks.
Now that you’re equipped with the knowledge of some of the key RevOps KPIs, it’s time to put that knowledge into action.
Growblocks is the Revenue Operations platform designed to help RevOps and CROs calculate, track and monitor every important KPI and metric within your revenue engine. With our innovative GTM Data modeling, you can do GTM Planning, Forecasting, and Monitoring like never before. Discover issues in your GTM engine with a single click, build robust plans, and let Growblocks provide real-time expectations for every metric.
Ready to transform your GTM engine? Learn more about how Growblocks can drive your revenue growth.